Student Achievement
West Kentucky Community and Technical College (WKCTC) uses its graduation rate, retention rate, transfer rate, and employment outcomes each academic year to document student success.
Graduation Rate
Data Source: Integrated Postsecondary Education Data System (IPEDs); DSS Performance Measures Dashboard: CPE Strategic Agenda
- Definition: Cohort of first-time, full-time, credential-seeking undergraduates who complete their program within 150% of normal time as reported to the Integrated Postsecondary Education Data System (IPEDS).
- Target: Increase by .3 percentage points each year from the baseline.
- Minimum Threshold of Acceptability: To meet or exceed the KCTCS System Average.
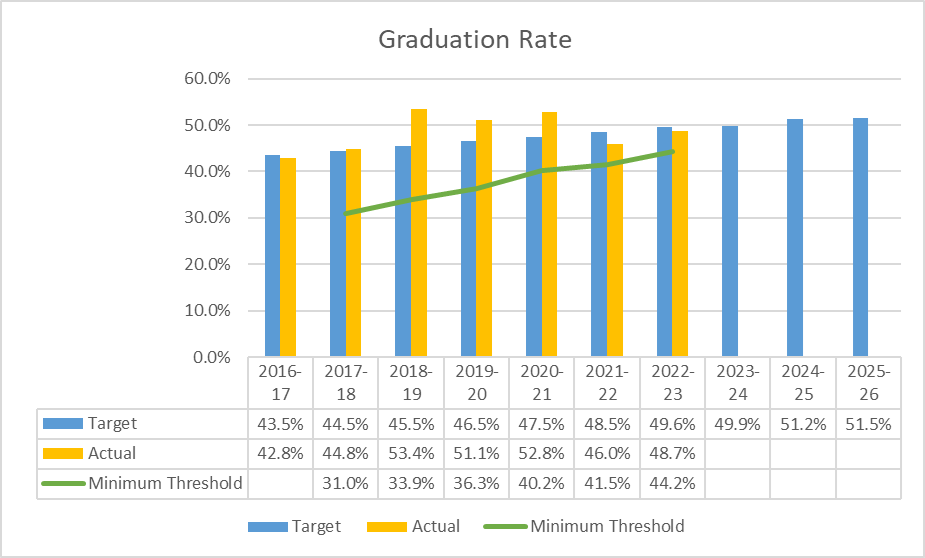
| Academic Year | Target | Actual | Minimum Threshold |
|---|---|---|---|
| 2016-2017 | 43.5% | 42.8% | |
| 2017-2018 | 44.5% | 44.8% | 31.0% |
| 2018-2019 | 45.5% | 53.4% | 33.9% |
| 2019-2020 | 46.5% | 51.1% | 36.3% |
| 2020-2021 | 47.5% | 52.8% | 40.2% |
| 2021-2022 | 48.5% | 46.0% | 41.5% |
| 2022-2023 | 49.6% | 48.7% | 44.2% |
| 2023-2024 | 49.9% | N/A | N/A |
| 2024-2025 | 51.2% | N/A | N/A |
| 2025-2026 | 51.5% | N/A | N/A |
- Definition: Cohort of first-time, full-time, credential-seeking low-income undergraduates who complete their program within 150% of normal time as reported to the Integrated Postsecondary Education Data System (IPEDS). Low-income students are defined as those receiving a Pell grant in their first year.
- Target: Meet the targets as set by the Council of Postsecondary Education (CPE).
- Minimum Threshold of Acceptability: To meet or exceed the KCTCS System Average.
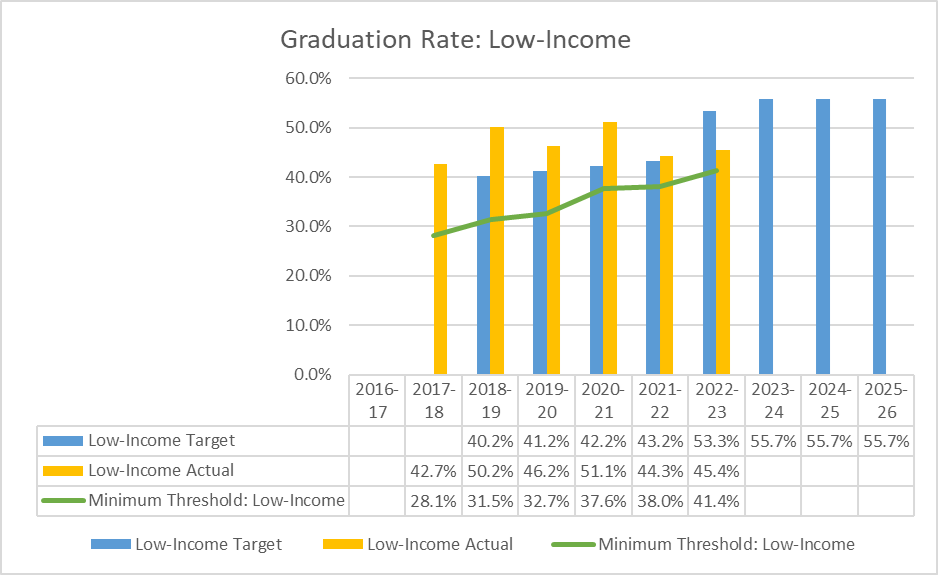
| Academic Year | Target | Actual | Minimum Threshold |
|---|---|---|---|
| 2017-2018 | N/A | 42.7% | 28.1% |
| 2018-2019 | 40.2% | 50.2% | 31.5% |
| 2019-2020 | 41.2% | 46.2% | 32.7% |
| 2020-2021 | 42.2% | 51.1% | 37.6% |
| 2021-2022 | 43.2% | 44.3% | 38.2% |
| 2022-2023 | 53.3% | 45.4% | 41.4 |
| 2023-2024 | 55.7% | N/A | N/A |
| 2024-2025 | 55.7% | N/A | N/A |
| 2025-2026 | 55.7% | N/A | N/A |
- Definition: Cohort of first-time, part-time, credential-seeking low-income undergraduates who complete their program within 150% of normal time as reported to the Integrated Postsecondary Education Data System (IPEDS).
- Target: Meet the targets as set by the Council of Postsecondary Education (CPE).
- Minimum Threshold of Acceptability: To meet or exceed the KCTCS System Average.
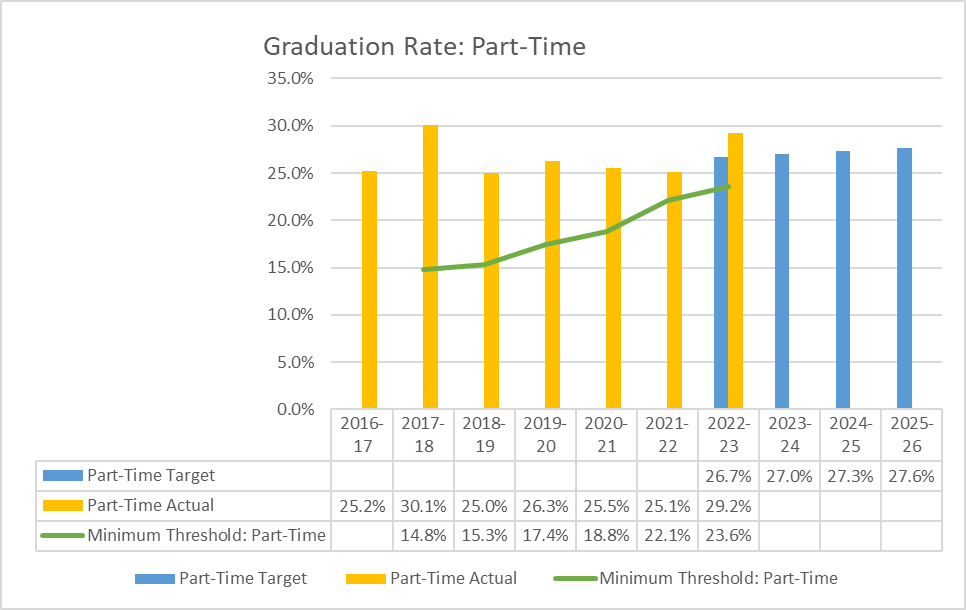
| Academic Year | Target | Actual | Minimum Threshold |
|---|---|---|---|
| 2016-2017 | N/A | 25.2% | N/A |
| 2017-2018 | N/A | 30.1% | 14.8% |
| 2018-2019 | N/A | 25.0% | 15.3% |
| 2019-2020 | N/A | 26.3% | 17.4% |
| 2020-2021 | N/A | 25.5% | 18.8% |
| 2021-2022 | N/A | 22.1% | 22.1% |
| 2022-2023 | 26.7% | 29.2% | 23.6% |
| 2023-2024 | 27.0% | N/A | N/A |
| 2024-2025 | 27.3% | N/A | N/A |
| 2025-2026 | 27.6% | N/A | N/A |
Retention Rate
Data Source: DSS Performance Measures Dashboard: CPE Strategic Agenda
- Definition: Cohort of first-time credential-seeking undergraduates regardless of enrollment status who remain enrolled the subsequent fall semester as reported to IPEDs.
- Target: Increase retention by an average of 1 percentage point each year from the last five-year average.
- Minimum Threshold of Acceptability: To meet or exceed the KCTCS System Average.
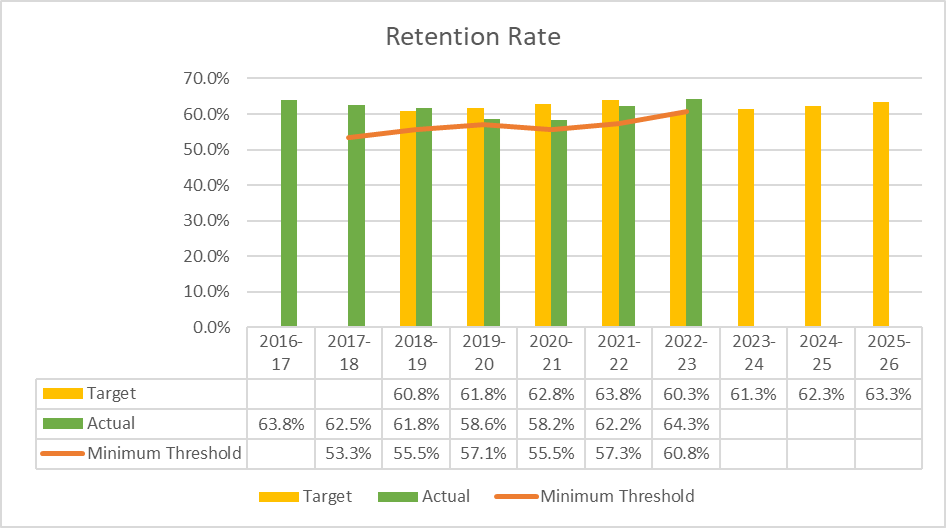
| Academic Year | Target | Actual | Minimum Threshold |
|---|---|---|---|
| 2016-2017 | N/A | 63.8% | N/A |
| 2017-2018 | N/A | 62.5% | 53.3% |
| 2018-2019 | 60.8% | 61.8% | 55.5% |
| 2019-2020 | 61.8% | 58.6% | 57.1% |
| 2020-2021 | 62.8% | 58.2% | 55.5% |
| 2021-2022 | 63.8% | 62.2% | 57.7% |
| 2022-2023 | 60.3% | 64.3% | 60.8% |
| 2023-2024 | 61.3% | N/A | N/A |
| 2024-2025 | 62.3% | N/A | N/A |
| 2025-2026 | 63.3% | N/A | N/A |
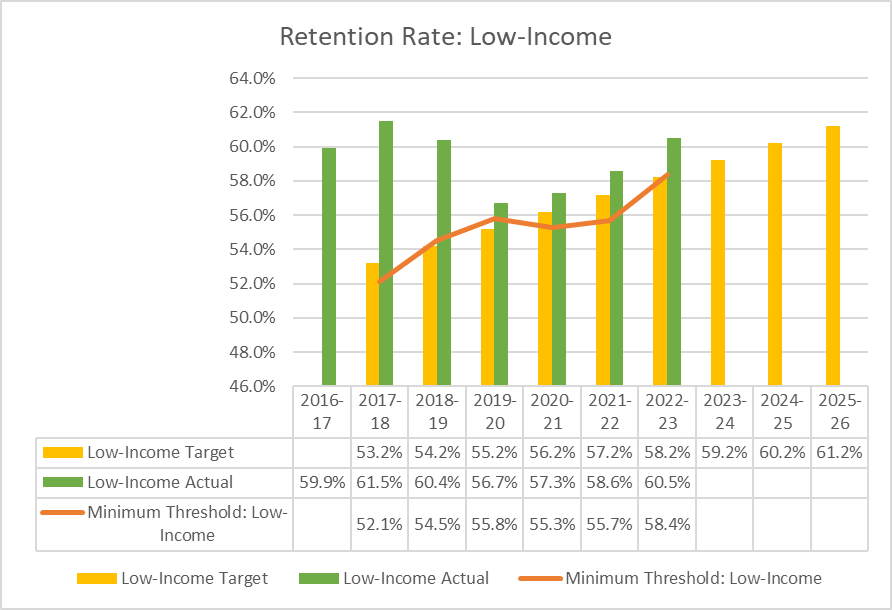
- Definition: Cohort of first-time credential-seeking undergraduates who remain enrolled the subsequent fall semester as reported to IPEDs.
- Target: Increase retention by an average of 1 percentage point each year from the last five-year average.
- Minimum Threshold of Acceptability: To meet or exceed the KCTCS System Average.
| Academic Year | Target | Actual | Minimum Threshold |
|---|---|---|---|
| 2016-2017 | N/A | 59.9% | N/A |
| 2017-2018 | 53.2% | 61.5% | 52.1% |
| 2018-2019 | 54.2% | 60.4% | 54.5% |
| 2019-2020 | 55.2% | 56.7% | 55.8% |
| 2020-2021 | 56.2% | 57.3% | 55.3% |
| 2021-2022 | 57.2% | 58.6% | 56.3% |
| 2022-2023 | 58.2% | 60.5% | 58.4% |
| 2023-2024 | 59.2% | N/A | N/A |
| 2024-2025 | 60.2% | N/A | N/A |
| 2025-2026 | 61.2% | N/A | N/A |
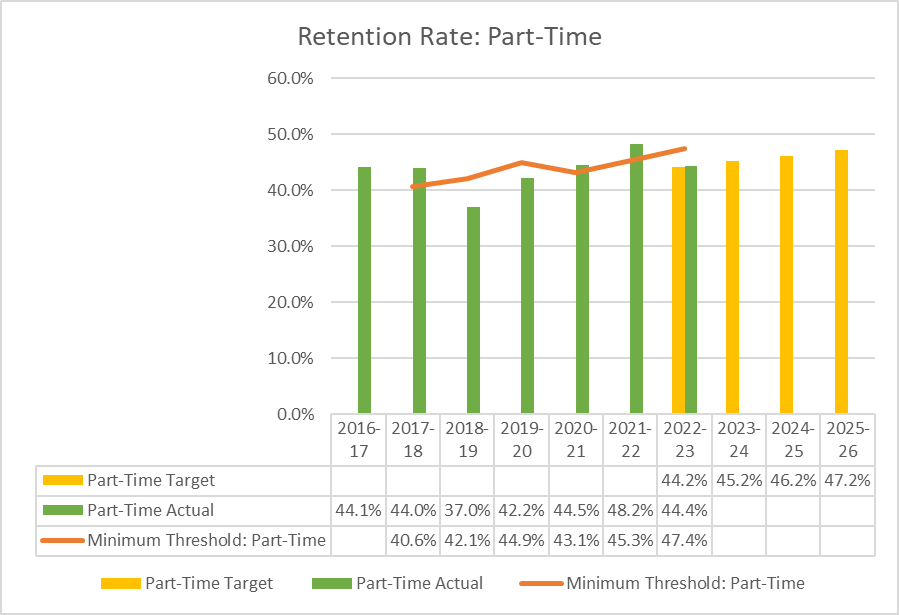
- Definition: Cohort of first-time, part-time credential-seeking undergraduates who remain enrolled the subsequent fall semester as reported to IPEDs.
- Target: Increase retention by an average of 1 percentage point each year.
- Minimum Threshold of Acceptability: To meet or exceed the KCTCS System Average.
| Academic Year | Target | Actual | Minimum Threshold |
|---|---|---|---|
| 2016-2017 | N/A | 44.1% | N/A |
| 2017-2018 | N/A | 44.0% | 40.6% |
| 2018-2019 | N/A | 37.0% | 42.1% |
| 2019-2020 | N/A | 42.2% | 44.9% |
| 2020-2021 | N/A | 44.5% | 43.1% |
| 2021-2022 | N/A | 48.2% | 45.7% |
| 2022-2023 | 44.2% | 44.4% | 47.4% |
| 2023-2024 | 45.2% | N/A | N/A |
| 2024-2025 | 46.2% | N/A | N/A |
| 2025-2026 | 47.2% | N/A | N/A |
Post-KCTCS Outcomes
Data Source: Office of Research and Policy Analysis
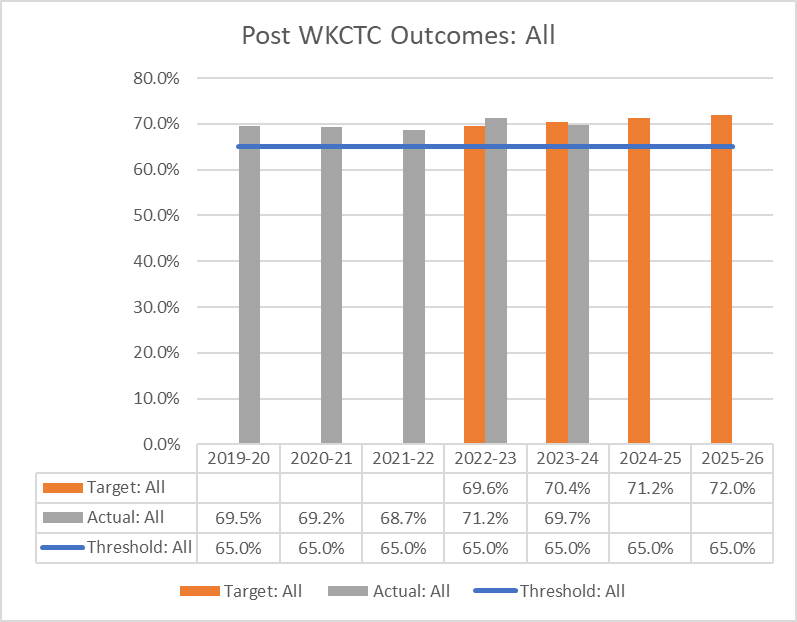
- Definition: Non-returning credential earners in one academic year that enroll at a four-year institution or are employed in Kentucky and earn a wage greater than or equal to the federal poverty level the following academic year.
- Target: Increase by 0.8 percentage point each year.
- Minimum Threshold of Acceptability: 65%.
| Academic Year | Target | Actual | Minimum Threshold |
|---|---|---|---|
| 2019-2020 | N/A | 69.5% | 65.0% |
| 2020-2021 | N/A | 69.2% | 65.0% |
| 2021-2022 | N/A | 68.7% | 65.0% |
| 2022-2023 | 69.6% | 71.2% | 65.0% |
| 2023-2024 | 70.4% | 69.7% | 65.0% |
| 2024-2025 | 81.2% | N/A | 65.0% |
| 2025-2026 | 72.0% | N/A | 65.0% |
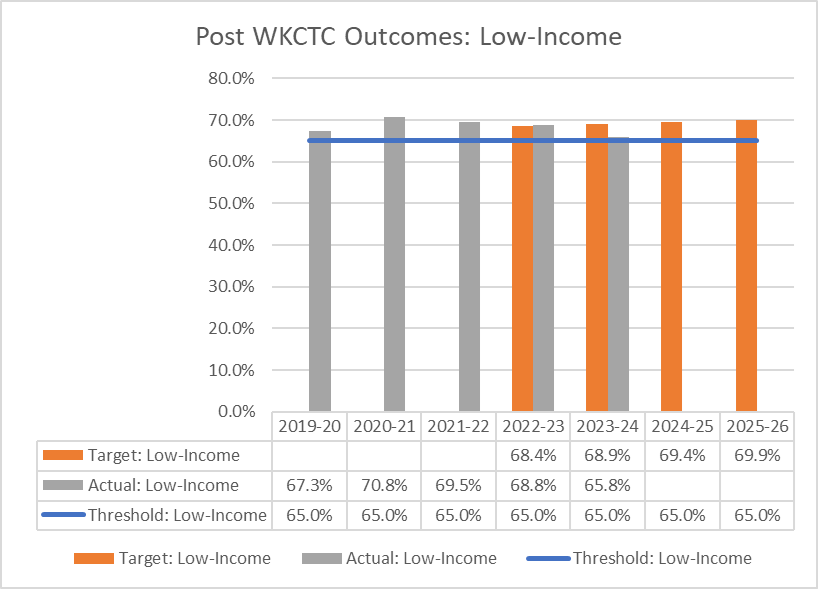
- Definition: Non-returning low-income credential earners in one academic year that enroll at a four-year institution or are employed in Kentucky and earn a wage greater than or equal to the federal poverty level the following academic year. Low-income students are defined as those receiving a Pell grant their first year.
- Target: Increase by 0.5 percentage points each year.
- Minimum Threshold of Acceptability: Meet or exceed the past five-year average of 65%.
| Academic Year | Target | Actual | Minimum Threshold |
|---|---|---|---|
| 2019-2020 | N/A | 67.3% | 65.0% |
| 2020-2021 | N/A | 70.8% | 65.0% |
| 2021-2022 | N/a | 69.5% | 65.0% |
| 2022-2023 | 68.4% | 68.8% | 65.0% |
| 2023-2024 | 68.9% | 65.8% | 65.0 |
| 2024-2025 | 69.4% | N/A | 65.0% |
| 2025-2026 | 69.9% | N/A | 65.0 |